IO Monitor
Disk I/O benchmarking and monitoring tools for Azure VMs
Covers Diskspd (Windows), FIO (Linux), and iotop/ps/top (Linux) for measuring and monitoring disk performance on Azure VMs with Azure Storage.
Diskspd
教程
- 在 Azure 磁盘存储上对应用程序进行基准测试 - Azure Virtual Machines | Microsoft Learn
- Benchmark your application on Azure Disk Storage - Azure Virtual Machines | Microsoft Learn
压测
- 测试 max Read IOPS
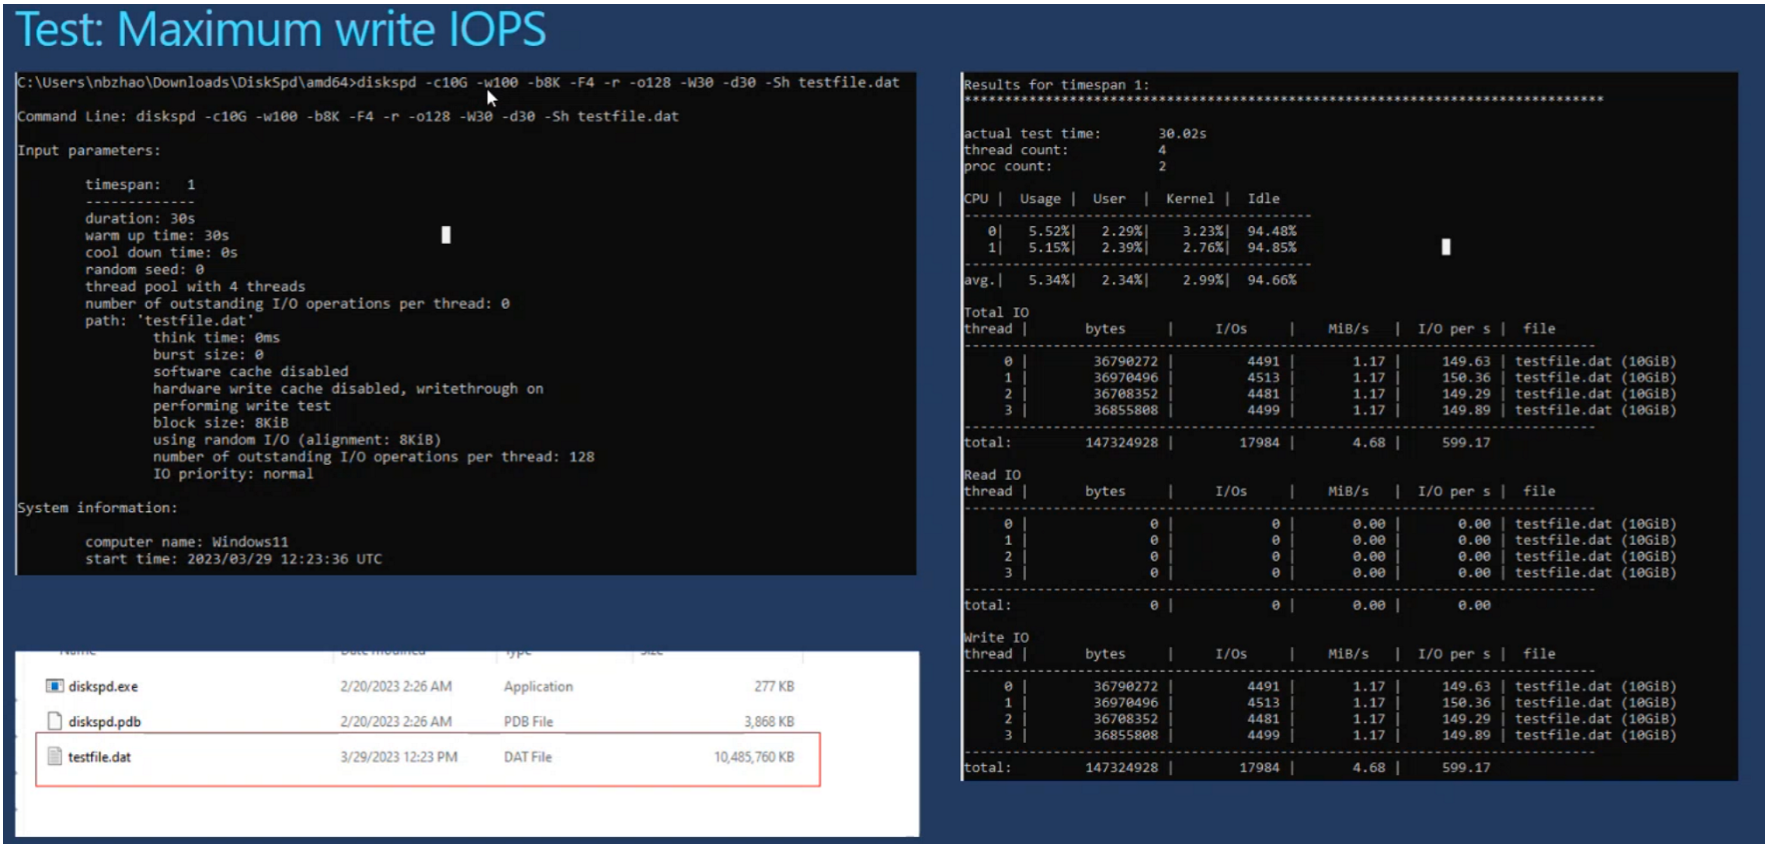
- 测试 max Read IOPS
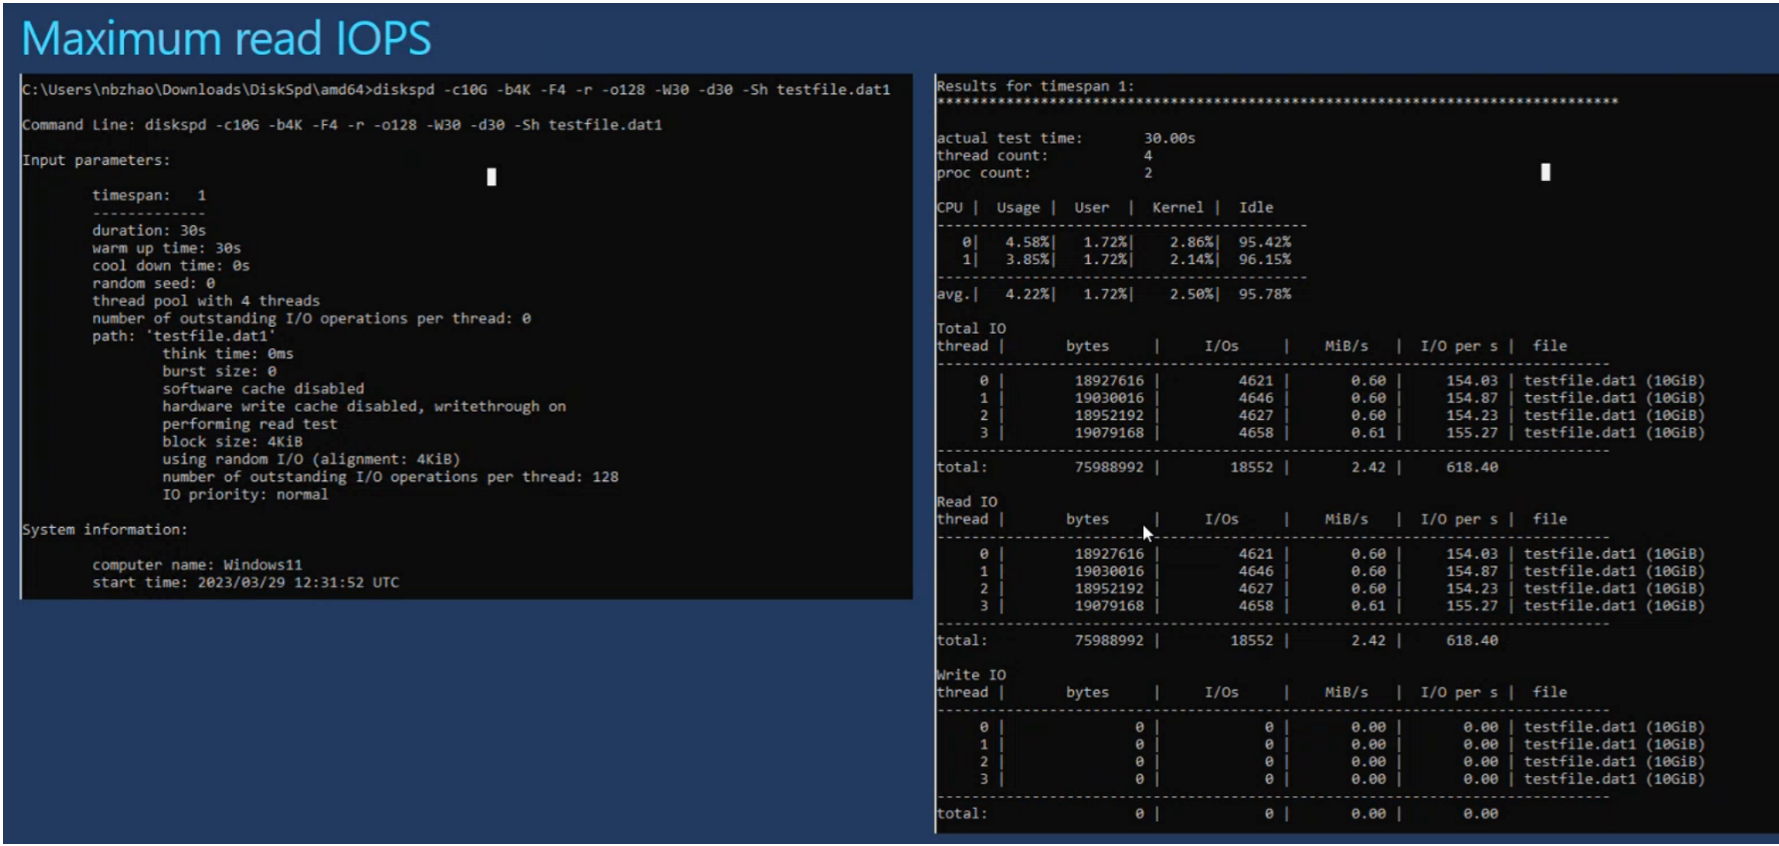
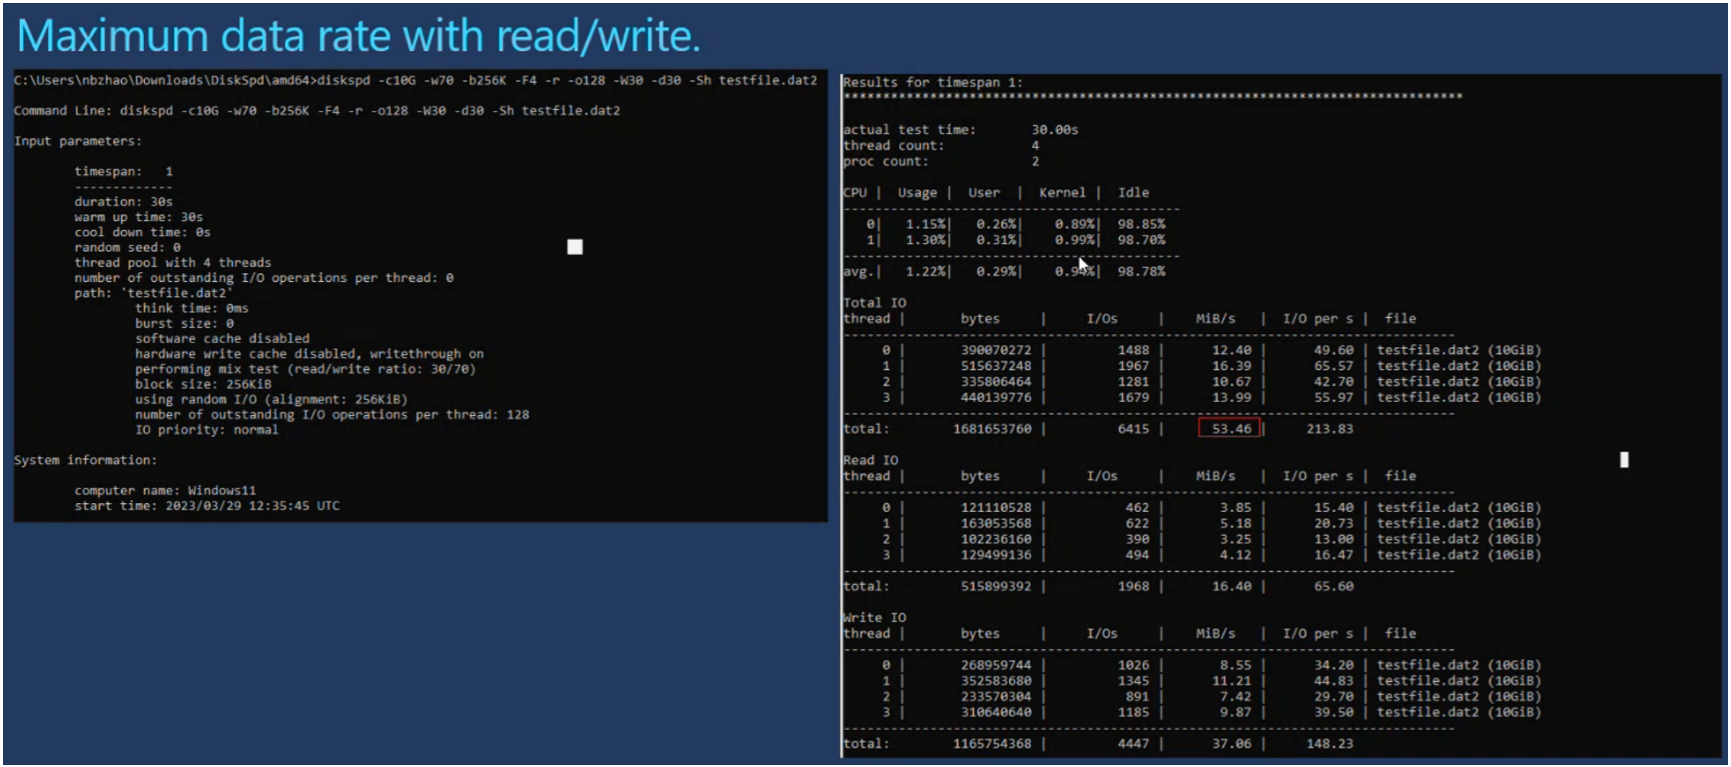
- 测试 max 吞吐量
- block size 要设的大一点
压测与 PerfMon 配合使用
配合 [[Azure/perfMon ProcessMon|PerfMon]] 使用可同时收集性能计数器数据
- 使用管理员权限打开 CMD 窗口,配置 PerfMon 信息:
Logman create counter Perf-2Second -f bincirc -max 500 -c "\LogicalDisk(*)\*" "\Memory\*" "\Network Interface(*)\*" "\Paging File(*)\*" "\PhysicalDisk(*)\*" "\Server\*" "\System\*" "\Process(*)\*" "\Processor(*)\*" "\Cache\*" -si 00:00:02 -o C:\PerfMonLogs\Perf-2Second.blg
- 开启 PerfMon:
Logman start Perf-2Second
- 在 Diskspd - amd64 路径下打开 cmd 窗口,运行以下命令,开始执行压测:
.\diskspd.exe -c200G -w0 -b8K -F16 -r -o128 -d60 -Sh D:\testfile.dat
#其中,D:\ 替换为需要测试的磁盘的盘符
- 压测结束后,命令行中会输出本次压测相关数据。此时,停止 PerfMon:
Logman stop Perf-2Second
FIO
Benchmark your application on Azure Disk Storage - Azure Virtual Machines | Microsoft Learn
iotop / ps / top
实时查看 IO 情况
top -ips -e -o pid,user,%mem,cmd --sort=-%mem
iotop 脚本
使用 iotop 脚本持续监控 I/O
脚本监控:使用 iotop 命令来监测服务器的状态,这样当问题重现时,我们可以对比发生问题的进程来进行排查。您可创建一个 cron job 在每分钟来收集一下 I/O 信息,并将其保存在日志文件中。
- 创建
/etc/cron.d/iotop文件,并添加以下内容:
vi /etc/cron.d/iotop
root /usr/sbin/iotop -botqqqk --iter=60 | grep -P "\d\d\.\d\d K/s"  >>/tmp/io.log 2>&1
#注:日志文件会不断增长,如果问题一直没有发生,请注意清理该文件。
日志文件会不断增长,如果问题一直没有发生,请注意清理该文件。