Helm部署Strimzi Kafka
介绍
Kafka
- Kafka 是一种高吞吐量的分布式发布订阅消息系统。主要用于实时数据流的处理和分析。它可以处理大量的实时数据,并提供高吞吐量、可扩展性和容错性。即使是非常普通的硬件Kafka也可以支持每秒数百万的消息。采用生产者消费者模型。
2、相关术语:
- Broker: Kafka集群包含一个或多个服务器,服务器被称为broker。Kafka的数据是分布式存储在各个Broker上的。每个Broker都会存储一部分Topic的Partition。Kafka的Broker主要用于存储和处理实时数据流。
- Topic: 每条发布到Kafka集群的消息都有一个类别,这个类别被称为Topic。(物理上不同Topic的消息分开存储,逻辑上一个Topic的消息虽然保存于一个或多个broker上,但用户只需指定消息的Topic,即可生产或消费数据,而不必关心数据存于何处)
- Partition: Partition是物理上的概念,每个Topic包含一个或多个Partition。
- Producer: 负责发布消息到Kafka broker
- Consumer: 消息消费者,向Kafka broker读取消息的客户端。
消费者的偏移量:
在Kafka中,消费者的偏移量(Consumer Offset)是一个非常重要的概念。它表示消费者在特定的主题和分区中已经消费到的位置。
Kafka的主题(Topic)被划分为一个或多个分区(Partition),每个分区中的消息都是有序的,并且每条消息在分区中都有一个唯一的序号,这个序号就是偏移量(Offset)。当消费者从分区中读取消息时,它会维护一个指针,这个指针指向下一条需要读取的消息的位置,这个位置就是消费者的偏移量。
消费者的偏移量是消费者消费消息的基础,通过维护每个消费者的偏移量,Kafka可以支持消息的重复消费,也就是说,消费者可以随时将偏移量回退到之前的位置,重新消费已经消费过的消息。同时,通过正确地管理消费者的偏移量,Kafka还可以实现消费者的故障恢复和负载均衡。
strimzi-kafka-operator
-
生产环境推荐的kafka部署方式为operator方式部署,Strimzi是目前最主流的operator方案。集群数据量较小的话,可以采用NFS共享存储,数据量较大的话可使用local pv存储。
-
release page:strimzi-kafka-operator Releases - GitHub
-
artifact hub: strimzi-kafka-operator - ArtifactHub
-
cluster operator部署出来之后,再去手动创建kafka cluster、topic operator、user operator等CRD资源。
-
cluster operator提供了这些CRD资源
| Strimzi resource | Long name | Short name |
|---|---|---|
| Kafka | kafka | k |
| Kafka Node Pool | kafkanodepool | knp |
| Kafka Topic | kafkatopic | kt |
| Kafka User | kafkauser | ku |
| Kafka Connect | kafkaconnect | kc |
| Kafka Connector | kafkaconnector | kctr |
| Kafka MirrorMaker | kafkamirrormaker | kmm |
| Kafka MirrorMaker 2 | kafkamirrormaker2 | kmm2 |
| Kafka Bridge | kafkabridge | kb |
| Kafka Rebalance | kafkarebalance | kr |
kafka-ui
- 官网地址:Kafka UI Documentation
- release page: kafka-ui Releases - GitHub
- artifact hub: kafka-ui - ArtifactHub
kafka-mirror-maker
-
解决 Kafka 集群之间数据复制和数据同步的问题而诞生的 Kafka 官方的数据复制工具。在实际生产中,经常被用来实现 Kafka 数据的备份,迁移和灾备等目的。其实现原理是通过从Source Cluster消费消息,然后将消息生产到Target Cluster,即普通的消息生产和消费。用户只要通过简单的consumer配置和producer配置,启动Mirror,就可以实现准实时的数据同步。
部署srtimzi-kafka-operator
下载
helm repo add strimzi https://strimzi.io/charts/
helm repo update strimzi
helm pull strimzi/strimzi-kafka-operator --version 0.42.0
配置
- 开启了dashboard、watchAnyNamespace
安装
helm upgrade -i strimzi-kafka-operator -n kafka --create-namespace . --values values.yaml #--skip-crds --values $VALUES_FILE
卸载
完全卸载strimzi-kafka-operator之后要把CRD也删干净:
kubectl delete crd kafkabridges kafkaconnectors kafkaconnects kafkamirrormaker2s kafkamirrormakers kafkanodepools kafkarebalances kafkas kafkatopics kafkausers
升级
注意,strimzi-kafka-operator对kafka的版本是有要求的,升级strimzi的时候,需要检查现有的kafka版本是否适配:
-
strimzi和kafka的supported version对应表:Strimzi Downloads
如果希望升级到的strimzi版本,不支持现在的kafka版本,那么需要先把strimzi升级到支持当前kafka版本的最低版本。然后把kafka升级到新版,再升级strimzi到最新版。
部署kafka cluster和broker
- cluster operator部署完之后,去部署下面几个CRD资源,这些资源也是以helm chart形式部署,chart name:commoninfra-kafka-config
kafka-cluster
apiVersion: kafka.strimzi.io/v1beta2
kind: Kafka
metadata:
  name: {{ .Values.commoninfra.kafka.name }}
  namespace: kafka
  annotations:
    strimzi.io/kraft: "enabled"
    strimzi.io/node-pools: "enabled"
spec:
  kafka:
    version: {{ .Values.commoninfra.kafka.version }}
    listeners:
      - name: tls
        port: 9093
        type: internal
        tls: true
        authentication:
          type: tls
      - name: external
        port: 9094
        type: loadbalancer
        tls: true
        authentication:
          type: tls
        configuration:
          bootstrap:
            annotations:
              #service.beta.kubernetes.io/azure-load-balancer-internal: "true"
              #external-dns.alpha.kubernetes.io/hostname: kafka.{{ .Values.environment }}.{{ .Values.product }}#.{{ .Values.dns.domain }}
              #external-dns.alpha.kubernetes.io/ttl: "600"
            alternativeNames:
              - kafka.{{ .Values.environment }}.{{ .Values.product }} #.{{ .Values.dns.domain }}
          brokers:
            {{- $root := . -}}
            {{- range $i, $e := until (int .Values.commoninfra.kafka.replicas) }}
            - broker: {{ $i }}
              annotations:
                #service.beta.kubernetes.io/azure-load-balancer-internal: "true"
                #external-dns.alpha.kubernetes.io/hostname: kafka-broker-{{ $i }}.{{ $root.Values.environment }}.{{ $root.Values.product }}.{{ $root.Values.dns.domain }}
                #external-dns.alpha.kubernetes.io/ttl: "600"
              advertisedHost: kafka-broker-{{ $i }}.{{ $root.Values.environment }}.{{ $root.Values.product }} #.{{ $root.Values.dns.domain }}
            {{- end }}
    authorization:
      type: simple
    resources: {{- .Values.commoninfra.kafka.kafka_resources | toYaml | trim | nindent 6 }}
    jvmOptions:
      -Xms: 2500m
      -Xmx: 2500m
    config:
      offsets.topic.replication.factor: 3
      transaction.state.log.replication.factor: 3
      transaction.state.log.min.isr: 2
      default.replication.factor: 3
      min.insync.replicas: 2
      log.retention.ms: 604800000
      delete.topic.enable: true
      num.partitions: 6
      log.segment.bytes: 104857600
      log.roll.ms: 86400000
      auto.create.topics.enable: false
      socket.send.buffer.bytes: 102400
      socket.receive.buffer.bytes: 102400
      socket.request.max.bytes: 104857600
      replica.fetch.max.bytes: 104857600
      message.max.bytes: 104857600
    metricsConfig:
      type: jmxPrometheusExporter
      valueFrom:
        configMapKeyRef:
          name: kafka-metrics
          key: kafka-metrics-config.yml
    template:
      clusterCaCert:
        metadata:
          annotations:
            kubed.appscode.com/sync: "config-sync-kafka"
  entityOperator:
    topicOperator:
      resources:
        requests:
          memory: 128Mi
          cpu: "100m"
        limits:
          memory: 128Mi
          cpu: "750m"
      jvmOptions:
        -Xms: 256m
        -Xmx: 256m
    userOperator:
      resources:
        requests:
          memory: 128Mi
          cpu: "100m"
        limits:
          memory: 128Mi
          cpu: "750m"
      jvmOptions:
        -Xms: 256m
        -Xmx: 256m
  kafkaExporter: {}
kafka-broker-nodepool
apiVersion: kafka.strimzi.io/v1beta2
kind: KafkaNodePool
metadata:
  name: kafka
  namespace: kafka
  labels:
    strimzi.io/cluster: {{ .Values.commoninfra.kafka.name }}
spec:
  replicas: {{ .Values.commoninfra.kafka.replicas }}
  roles:
    - broker
  storage:
    type: {{ .Values.commoninfra.kafka.storage.type }}
    size: {{ .Values.commoninfra.kafka.storage.size }}
    class: {{ .Values.commoninfra.kafka.storage.class }}
kafka-controller-nodepool
apiVersion: kafka.strimzi.io/v1beta2
kind: KafkaNodePool
metadata:
  name: controller
  namespace: kafka
  labels:
    strimzi.io/cluster: {{ .Values.commoninfra.kafka.name }}
spec:
  replicas: {{ .Values.commoninfra.kafka.replicas }}
  roles:
    - controller
  resources: {{- .Values.commoninfra.kafka.kafka_controller_resources | toYaml | trim | nindent 4 }}
  storage:
    type: {{ .Values.commoninfra.kafka.storage.type }}
    size: {{ .Values.commoninfra.kafka.storage.size }}
    class: {{ .Values.commoninfra.kafka.storage.class }}
以上两种KafkaNodepool:
- Controller角色:
- Controller是Kafka集群中的管理节点,负责管理分区(Partition)和副本(Replica)的状态。它负责监控Broker的健康状态,并在Broker失效时进行故障转移,确保集群的高可用性。Controller还负责处理分区领导者的选举和副本的同步。
- Broker角色:
- Broker是Kafka集群中的消息存储和处理节点。它负责接收生产者发送的消息,并将消息存储在相应的分区中。同时,Broker也负责处理消费者拉取消息的请求。一个Kafka集群通常由多个Broker组成,每个Broker可以容纳多个主题(Topic)和分区(Partition)。
(Kafka 3.4+ 支持分离 Controller 角色,独立管理避免单点故障)
kafka-metrics-config
# This file is copy from
# https://github.com/strimzi/strimzi-kafka-operator/blob/<strimzi_version>/examples/metrics/kafka-metrics.yaml
kind: ConfigMap
apiVersion: v1
metadata:
  name: kafka-metrics
  namespace: kafka
  labels:
    app: strimzi
data:
  kafka-metrics-config.yml: |
    # See https://github.com/prometheus/jmx_exporter for more info about JMX Prometheus Exporter metrics
    lowercaseOutputName: true
    rules:
    # Special cases and very specific rules
    - pattern: kafka.server<type=(.+), name=(.+), clientId=(.+), topic=(.+), partition=(.*)><>Value
      name: kafka_server_$1_$2
      type: GAUGE
      labels:
        clientId: "$3"
        topic: "$4"
        partition: "$5"
    - pattern: kafka.server<type=(.+), name=(.+), clientId=(.+), brokerHost=(.+), brokerPort=(.+)><>Value
      name: kafka_server_$1_$2
      type: GAUGE
      labels:
        clientId: "$3"
        broker: "$4:$5"
    - pattern: kafka.server<type=(.+), cipher=(.+), protocol=(.+), listener=(.+), networkProcessor=(.+)><>connections
      name: kafka_server_$1_connections_tls_info
      type: GAUGE
      labels:
        cipher: "$2"
        protocol: "$3"
        listener: "$4"
        networkProcessor: "$5"
    - pattern: kafka.server<type=(.+), clientSoftwareName=(.+), clientSoftwareVersion=(.+), listener=(.+), networkProcessor=(.+)><>connections
      name: kafka_server_$1_connections_software
      type: GAUGE
      labels:
        clientSoftwareName: "$2"
        clientSoftwareVersion: "$3"
        listener: "$4"
        networkProcessor: "$5"
    - pattern: "kafka.server<type=(.+), listener=(.+), networkProcessor=(.+)><>(.+-total):"
      name: kafka_server_$1_$4
      type: COUNTER
      labels:
        listener: "$2"
        networkProcessor: "$3"
    - pattern: "kafka.server<type=(.+), listener=(.+), networkProcessor=(.+)><>(.+):"
      name: kafka_server_$1_$4
      type: GAUGE
      labels:
        listener: "$2"
        networkProcessor: "$3"
    - pattern: kafka.server<type=(.+), listener=(.+), networkProcessor=(.+)><>(.+-total)
      name: kafka_server_$1_$4
      type: COUNTER
      labels:
        listener: "$2"
        networkProcessor: "$3"
    - pattern: kafka.server<type=(.+), listener=(.+), networkProcessor=(.+)><>(.+)
      name: kafka_server_$1_$4
      type: GAUGE
      labels:
        listener: "$2"
        networkProcessor: "$3"
    # Some percent metrics use MeanRate attribute
    # Ex) kafka.server<type=(KafkaRequestHandlerPool), name=(RequestHandlerAvgIdlePercent)><>MeanRate
    - pattern: kafka.(\w+)<type=(.+), name=(.+)Percent\w*><>MeanRate
      name: kafka_$1_$2_$3_percent
      type: GAUGE
    # Generic gauges for percents
    - pattern: kafka.(\w+)<type=(.+), name=(.+)Percent\w*><>Value
      name: kafka_$1_$2_$3_percent
      type: GAUGE
    - pattern: kafka.(\w+)<type=(.+), name=(.+)Percent\w*, (.+)=(.+)><>Value
      name: kafka_$1_$2_$3_percent
      type: GAUGE
      labels:
        "$4": "$5"
    # Generic per-second counters with 0-2 key/value pairs
    - pattern: kafka.(\w+)<type=(.+), name=(.+)PerSec\w*, (.+)=(.+), (.+)=(.+)><>Count
      name: kafka_$1_$2_$3_total
      type: COUNTER
      labels:
        "$4": "$5"
        "$6": "$7"
    - pattern: kafka.(\w+)<type=(.+), name=(.+)PerSec\w*, (.+)=(.+)><>Count
      name: kafka_$1_$2_$3_total
      type: COUNTER
      labels:
        "$4": "$5"
    - pattern: kafka.(\w+)<type=(.+), name=(.+)PerSec\w*><>Count
      name: kafka_$1_$2_$3_total
      type: COUNTER
    # Generic gauges with 0-2 key/value pairs
    - pattern: kafka.(\w+)<type=(.+), name=(.+), (.+)=(.+), (.+)=(.+)><>Value
      name: kafka_$1_$2_$3
      type: GAUGE
      labels:
        "$4": "$5"
        "$6": "$7"
    - pattern: kafka.(\w+)<type=(.+), name=(.+), (.+)=(.+)><>Value
      name: kafka_$1_$2_$3
      type: GAUGE
      labels:
        "$4": "$5"
    - pattern: kafka.(\w+)<type=(.+), name=(.+)><>Value
      name: kafka_$1_$2_$3
      type: GAUGE
    # Emulate Prometheus 'Summary' metrics for the exported 'Histogram's.
    # Note that these are missing the '_sum' metric!
    - pattern: kafka.(\w+)<type=(.+), name=(.+), (.+)=(.+), (.+)=(.+)><>Count
      name: kafka_$1_$2_$3_count
      type: COUNTER
      labels:
        "$4": "$5"
        "$6": "$7"
    - pattern: kafka.(\w+)<type=(.+), name=(.+), (.+)=(.*), (.+)=(.+)><>(\d+)thPercentile
      name: kafka_$1_$2_$3
      type: GAUGE
      labels:
        "$4": "$5"
        "$6": "$7"
        quantile: "0.$8"
    - pattern: kafka.(\w+)<type=(.+), name=(.+), (.+)=(.+)><>Count
      name: kafka_$1_$2_$3_count
      type: COUNTER
      labels:
        "$4": "$5"
    - pattern: kafka.(\w+)<type=(.+), name=(.+), (.+)=(.*)><>(\d+)thPercentile
      name: kafka_$1_$2_$3
      type: GAUGE
      labels:
        "$4": "$5"
        quantile: "0.$6"
    - pattern: kafka.(\w+)<type=(.+), name=(.+)><>Count
      name: kafka_$1_$2_$3_count
      type: COUNTER
    - pattern: kafka.(\w+)<type=(.+), name=(.+)><>(\d+)thPercentile
      name: kafka_$1_$2_$3
      type: GAUGE
      labels:
        quantile: "0.$4"
    # KRaft overall related metrics
    # distinguish between always increasing COUNTER (total and max) and variable GAUGE (all others) metrics
    - pattern: "kafka.server<type=raft-metrics><>(.+-total|.+-max):"
      name: kafka_server_raftmetrics_$1
      type: COUNTER
    - pattern: "kafka.server<type=raft-metrics><>(.+):"
      name: kafka_server_raftmetrics_$1
      type: GAUGE
    # KRaft "low level" channels related metrics
    # distinguish between always increasing COUNTER (total and max) and variable GAUGE (all others) metrics
    - pattern: "kafka.server<type=raft-channel-metrics><>(.+-total|.+-max):"
      name: kafka_server_raftchannelmetrics_$1
      type: COUNTER
    - pattern: "kafka.server<type=raft-channel-metrics><>(.+):"
      name: kafka_server_raftchannelmetrics_$1
      type: GAUGE
    # Broker metrics related to fetching metadata topic records in KRaft mode
    - pattern: "kafka.server<type=broker-metadata-metrics><>(.+):"
      name: kafka_server_brokermetadatametrics_$1
      type: GAUGE
strimzi-pod-monitor
apiVersion: monitoring.coreos.com/v1
kind: PodMonitor
metadata:
  name: cluster-operator-metrics
  namespace: monitoring
  labels:
    app: strimzi
spec:
  selector:
    matchLabels:
      strimzi.io/kind: cluster-operator
  namespaceSelector:
    any: true
  podMetricsEndpoints:
  - path: /metrics
    port: http
---
apiVersion: monitoring.coreos.com/v1
kind: PodMonitor
metadata:
  name: entity-operator-metrics
  namespace: monitoring
  labels:
    app: strimzi
spec:
  selector:
    matchLabels:
      app.kubernetes.io/name: entity-operator
  namespaceSelector:
    any: true
  podMetricsEndpoints:
  - path: /metrics
    port: healthcheck
---
apiVersion: monitoring.coreos.com/v1
kind: PodMonitor
metadata:
  name: bridge-metrics
  namespace: monitoring
  labels:
    app: strimzi
spec:
  selector:
    matchLabels:
      strimzi.io/kind: KafkaBridge
  namespaceSelector:
    any: true
  podMetricsEndpoints:
  - path: /metrics
    port: rest-api
---
apiVersion: monitoring.coreos.com/v1
kind: PodMonitor
metadata:
  name: kafka-resources-metrics
  namespace: monitoring
  labels:
    app: strimzi
spec:
  selector:
    matchExpressions:
      - key: "strimzi.io/kind"
        operator: In
        values: ["Kafka", "KafkaConnect", "KafkaMirrorMaker", "KafkaMirrorMaker2"]
  namespaceSelector:
    any: true
  podMetricsEndpoints:
  - path: /metrics
    port: tcp-prometheus
    relabelings:
    - separator: ;
      regex: __meta_kubernetes_pod_label_(strimzi_io_.+)
      replacement: $1
      action: labelmap
    - sourceLabels: [__meta_kubernetes_namespace]
      separator: ;
      regex: (.*)
      targetLabel: namespace
      replacement: $1
      action: replace
    - sourceLabels: [__meta_kubernetes_pod_name]
      separator: ;
      regex: (.*)
      targetLabel: kubernetes_pod_name
      replacement: $1
      action: replace
    - sourceLabels: [__meta_kubernetes_pod_node_name]
      separator: ;
      regex: (.*)
      targetLabel: node_name
      replacement: $1
      action: replace
    - sourceLabels: [__meta_kubernetes_pod_host_ip]
      separator: ;
      regex: (.*)
      targetLabel: node_ip
      replacement: $1
      action: replace
values
- values.yaml
environment: "hanxux"
cloud: "azurechinacloud" #azurecloudchina
product: "local"
#dns:
  #domain: "onepilot.azurecn.autoheim.net"
  #subscription_id: "e8aaa21f-52cf-48d2-9293-796ab1dddaeb"
  #resource_group_name: "rg-es-identity-dns-chinanorth3"
commoninfra:
  kafka:
    name: kafka
    zoneredundant: "false"
    version: 3.7.1
    replicas: 3
    storage:
      type: persistent-claim
      size: "1Gi"
      class: sc-nfs
    kafka_controller_resources:
      requests:
        cpu: 300m
        memory: 200Mi
      limits:
        cpu: 600m
        memory: 2Gi
    kafka_resources:
      requests:
        ## see https://github.com/strimzi/strimzi-kafka-bridge/issues/731
        cpu: 300m
        memory: 200Mi
      limits:
        cpu: 600m
        memory: 2Gi
提示
- 上面的是仿照ado中的配置,但是在本地nodepool创建不出来。
- 下面用官网给的示例可以成功创建:kafka-single-node.yaml - GitHub
apiVersion: kafka.strimzi.io/v1beta2
kind: KafkaNodePool
metadata:
  name: dual-role
  namespace: kafka
  labels:
    strimzi.io/cluster: my-cluster
spec:
  replicas: 1
  roles:
    - controller
    - broker
  storage:
    type: jbod
    volumes:
      - id: 0
        type: persistent-claim
        size: 1Gi
        class: sc-nfs
        deleteClaim: false
        kraftMetadata: shared
--
apiVersion: kafka.strimzi.io/v1beta2
kind: Kafka
metadata:
  name: my-cluster
  namespace: kafka
  annotations:
    strimzi.io/node-pools: enabled
    strimzi.io/kraft: enabled
spec:
  kafka:
    version: 3.7.1
    #metadataVersion: 3.8-IV0
    authorization:
      type: simple
    listeners:
      - name: plain
        port: 9092
        type: internal
        tls: false
      - name: tls
        port: 9093
        type: internal
        tls: true
    config:
      offsets.topic.replication.factor: 1
      transaction.state.log.replication.factor: 1
      transaction.state.log.min.isr: 1
      default.replication.factor: 1
      min.insync.replicas: 1
  entityOperator:
    topicOperator: {}
    userOperator: {}
安装
helm upgrade -i commoninfra-kafka-config -n kube-system . --values ./values/values.yaml #--set oauth.secretProviderIdentityId=$secretProviderIdentityId
卸载
如果报错invalid cluster id,先把helm release uninstall掉,再把kafka的PVC和PV删干净,再重新部署。
部署kafka-ui
kafka-ui-config
- template/kafka_ui_user.yaml
apiVersion: kafka.strimzi.io/v1beta1
kind: KafkaUser
metadata:
  name: kafka-ui-client
  labels:
    strimzi.io/cluster: my-cluster
  namespace: kafka
spec:
  authentication:
    type: tls
  authorization:
    acls:
      {{- with .Values.acls }}
        {{- toYaml . | nindent 6 }}
      {{- end }}
      - resource:
          name: 'kafka-ui-client'
          patternType: literal
          type: group
        operations:
          - All
      - resource:
          type: cluster
        operations:
          - Describe
          - DescribeConfigs
    type: simple
  template:
    secret:
      metadata:
        annotations:
          kubed.appscode.com/sync: "config-sync-app=kafka-ui" #config-syncer会把这个secret自动同步到具有标签config-sync-app=kafka-ui的namespace
- values.yaml
acls:
  - resource:
      name: '*'
      patternType: literal
      type: topic
    operations:
      - Read
      - Write
      - Describe
      - DescribeConfigs
      - Alter
      - AlterConfigs
  - resource:
      name: '*'
      patternType: literal
      type: group
    operations:
      - Describe
      - Read
- 安装
helm upgrade -i commoninfra-kafka-ui-config -n kafka . --values $VALUES_FILE
kafka-ui本体
- 下载安装
helm repo add kafka-ui https://provectus.github.io/kafka-ui-charts
helm repo update kafka-ui
helm pull kafka-ui/kafka-ui --version 0.7.6
helm upgrade -i kafka-ui -n kafka --values values.yaml
- 配置ingress和tls
# 先创建certificate
tee certificate-kafka-ui.yaml <<'EOF'
apiVersion: cert-manager.io/v1
kind: Certificate
metadata:
  name: cert-kafka-ui
  namespace: kafka
spec:
  secretName: kafka-ui-tls-cert-secret
  privateKey:
    rotationPolicy: Always
  commonName: kafka-ui.hanxux.local
  dnsNames:
    - kafka-ui.hanxux.local
  usages:
    - digital signature
    - key encipherment
    - server auth
  issuerRef:
    name: selfsigned
    kind: ClusterIssuer
EOF
ingress:
  # Enable ingress resource
  enabled: true

  # Annotations for the Ingress
  annotations:
    nginx.ingress.kubernetes.io/auth-url: "http://oauth2-proxy.oauth2-proxy.svc.cluster.local/oauth2/auth"
    nginx.ingress.kubernetes.io/auth-signin: "https://oauth2proxy.hanxux.local/oauth2/start?rd=https%3A%2F%2Fkafka-ui.hanxux.local"

  # ingressClassName for the Ingress
  ingressClassName: "nginx-default"

  # The path for the Ingress
  path: "/"

  # The path type for the Ingress
  pathType: "Prefix"

  # The hostname for the Ingress
  host: "kafka-ui.hanxux.local"
  tls:
    # Enable TLS termination for the Ingress
    enabled: true
    # the name of a pre-created Secret containing a TLS private key and certificate
    secretName: "cert-kafka-ui"
- 配置oauth2proxy:ingress添加annotations:
annotations:
  nginx.ingress.kubernetes.io/auth-url: "http://oauth2-proxy.oauth2-proxy.svc.cluster.local/oauth2/auth"
  nginx.ingress.kubernetes.io/auth-signin: "https://oauth2proxy.hanxux.local/oauth2/start?rd=https%3A%2F%2Fkafka-ui.hanxux.local"
- 安装
helm upgrade -i kafka-ui -n kafka . --values values.yaml
kafka-ui连接cluster
- 通过values.yaml环境变量来配置的。
-
ado里面配置的使用kafka-ui-client的secret做认证,在本地部署有点问题,遂添加AUTH_TYPE=DISABLED参数,在UI上就能看到online的cluster了。这样部署的话前面的kafka-ui-config就暂时不需要了。
-
配置方法可以参考官网:Kafka UI Configuration
env:
  - name: MANAGEMENT_HEALTH_LDAP_ENABLED
    value: "FALSE"
  - name: AUTH_TYPE
    value: "DISABLED"
  - name: DYNAMIC_CONFIG_ENABLED
    value: "true"
  - name: LOGGING_LEVEL_PROVECTUS
    value: info
  - name: KAFKA_CLUSTERS_0_NAME
    value: my-cluster
  # - name: KAFKA_CLUSTERS_0_PROPERTIES_SECURITY_PROTOCOL
  #   value: SSL
  - name: KAFKA_CLUSTERS_0_BOOTSTRAPSERVERS
    value: my-cluster-kafka-bootstrap.kafka.svc:9092
  #- name: KAFKA_CLUSTERS_0_SCHEMAREGISTRY
    #value: http://apicurio-schema-registry.apicurio-schema-registry.svc:8080/apis/ccompat/v6
#   - name: KAFKA_CLUSTERS_0_PROPERTIES_SSL_TRUSTSTORE_TYPE
#     value: "PKCS12"
#   - name: KAFKA_CLUSTERS_0_PROPERTIES_SSL_TRUSTSTORE_PASSWORD
#     valueFrom:
#       secretKeyRef:
#         name: kafka-cluster-ca-cert
#         key: ca.password
#   - name: KAFKA_CLUSTERS_0_PROPERTIES_SSL_TRUSTSTORE_LOCATION
#     value: "/etc/kafka/ca-secret/ca.p12"
#   - name: KAFKA_CLUSTERS_0_PROPERTIES_SSL_KEYSTORE_TYPE
#     value: "PKCS12"
#   - name: KAFKA_CLUSTERS_0_PROPERTIES_SSL_KEYSTORE_PASSWORD
#     valueFrom:
#       secretKeyRef:
#         name: kafka-ui-client
#         key: user.password
#   - name: KAFKA_CLUSTERS_0_PROPERTIES_SSL_KEYSTORE_LOCATION
#     value: "/etc/kafka/client-secret/user.p12"

# volumeMounts:
#   - name: kafka-ui-client
#     mountPath: "/etc/kafka/client-secret/"
#   - name: kafka-cluster-ca-cert
#     mountPath: "/etc/kafka/ca-secret/"

# volumes:
#   - name: kafka-ui-client
#     secret:
#       secretName: kafka-ui-client
#   - name: kafka-cluster-ca-cert
#     secret:
#       secretName: kafka-cluster-ca-cert
Kafka 生产避坑:副本同步与云厂商默认配置陷阱
来源:一次凌晨 2 点 Kafka 事故复盘——3 个消费者只有 1 个在工作,另外 2 个副本压根没同步。根因不是网络故障、代码 Bug 或硬件损坏,而是云厂商的"默认配置"在作祟。
事故还原
事故配置
| 参数 | 配置值 | 含义 |
|---|---|---|
replication.factor |
3 | 每个分区 3 个副本 |
min.insync.replicas |
1 | 最少同步副本数 |
acks |
1 | 生产者确认机制 |
触发链
- 凌晨 1:30,一个 Broker 节点磁盘故障离线
- 该节点上的副本全部不可用
min.insync.replicas=1→ 集群认为"只要 1 个副本存活"就算健康- 离线 Broker 恰好是 Leader,其他 2 个 Follower 数据未完全同步
- 新 Leader 选举后,部分分区数据出现"空洞"
- 消费者读取到不一致数据,业务逻辑异常
根因
min.insync.replicas=1 允许 Leader 确认写入时只要自己收到数据就算成功,不需要等待任何 Follower 确认。在多副本场景下,等于把数据一致性交给了运气。
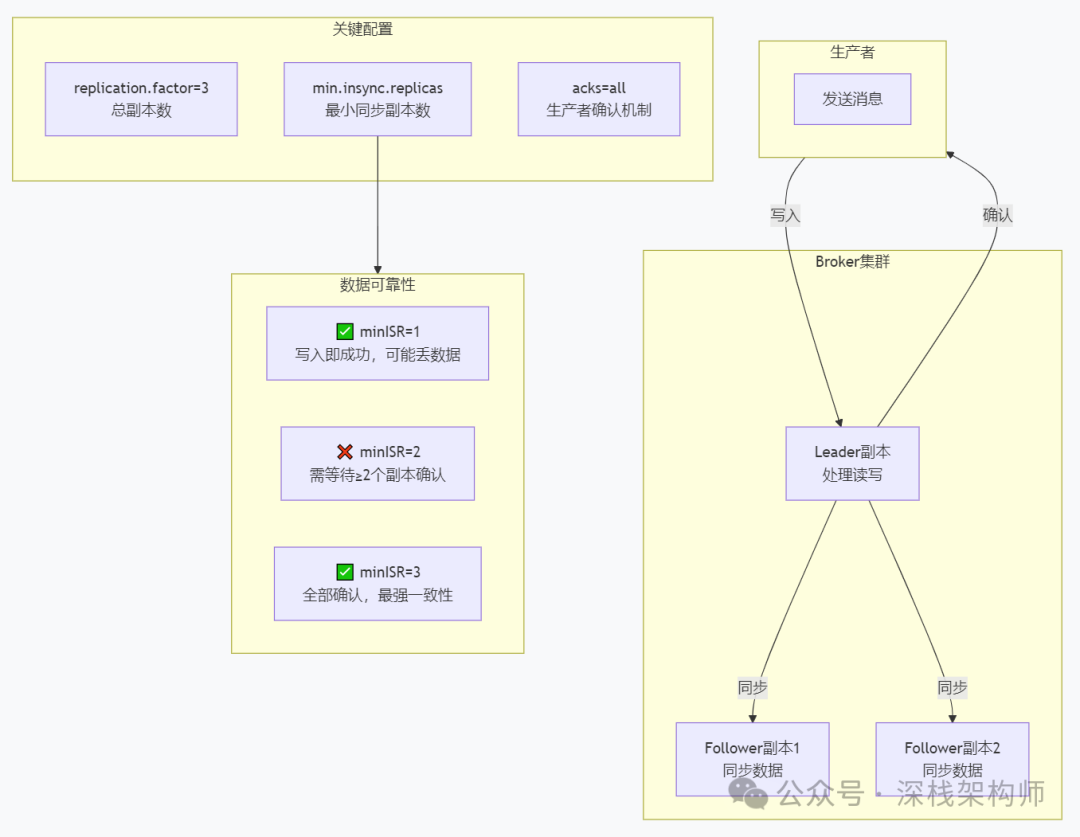
Kafka 副本同步核心参数
| 参数 | 作用 |
|---|---|
replication.factor |
总共有多少个副本(包括 Leader) |
min.insync.replicas |
至少需要多少个副本完成同步,生产者才收到写入成功确认 |
acks=all |
生产者要求 Leader 等待所有 ISR(In-Sync Replicas)副本确认后才返回成功 |
unclean.leader.election.enable |
是否允许非 ISR 副本成为 Leader(生产环境必须设为 false) |
min.insync.replicas 对数据可靠性的影响
| min.insync.replicas | 允许丢失的副本数 | 数据可靠性 |
|---|---|---|
| 1 | 2 个可以同时丢失 | ⚠️ 低(有丢数据风险) |
| 2 | 1 个可以丢失 | ✅ 中(多数场景够用) |
| 3 | 0 个可以丢失 | 高(强一致性,但性能有损) |
生产环境标准配置
Kafka 核心参数
| 参数 | 开发/测试 | 生产环境 | 说明 |
|---|---|---|---|
replication.factor |
1 | 3 | 至少 3 副本 |
min.insync.replicas |
1 | 2 | 至少 2 个副本同步 |
acks |
1 | all | 等待所有 ISR 确认 |
unclean.leader.election.enable |
true | false | 禁止非 ISR 副本成为 Leader |
Topic 创建
kafka-topics --create \
  --topic order-events \
  --partitions 6 \
  --replication-factor 3 \
  --config min.insync.replicas=2 \
  --config unclean.leader.election.enable=false \
  --zookeeper localhost:2181
生产者端配置(Java)
Properties props = new Properties();
props.put("acks", "all");                                   // 等待所有 ISR 确认
props.put("retries", 3);                                    // 失败重试
props.put("enable.idempotence", true);                      // 开启幂等性
props.put("max.in.flight.requests.per.connection", 1);      // 保证顺序
监控告警
# Prometheus 告警规则
- alert: KafkaMinISRTooLow
  expr: kafka_topic_partition_min_isr < 2
  for: 1m
  annotations:
    summary: "Topic {{$labels.topic}} 的 minISR 配置小于 2"

- alert: KafkaUnderReplicatedPartitions
  expr: kafka_controller_under_replicated_partitions > 0
  for: 30s
  annotations:
    summary: "存在未同步的分区副本"
通用原则:云厂商默认配置审查清单
云厂商的默认配置通常是"最低可行配置"——让你先跑起来,不是"生产可用"。
常见组件的"坑人默认配置"
| 组件 | 默认配置 | 风险 | 生产建议 |
|---|---|---|---|
| Kafka | min.insync.replicas=1 |
丢数据风险 | 设置为 2(3 副本时) |
| MySQL RDS | 单可用区 | 可用区故障即停服 | 多可用区部署 + 自动备份 |
| Redis | 禁用 AOF 持久化 | 重启丢数据 | 开启 AOF + appendfsync everysec |
| Nginx | keepalive_timeout=75s | 连接堆积 | 调整为 15-30s |
| K8s Deployment | replicas=1 | 单点故障 | replicas≥2 + PDB |
部署前审查六问
- 高可用:是否跨可用区部署?故障转移机制是什么?
- 数据持久性:是否有数据丢失风险?备份策略是什么?
- 监控告警:关键指标是否配置了告警?
- 容量规划:默认配额是否够用?有没有隐藏限制?
- 升级策略:自动升级是否开启?有没有兼容性问题?
- 费用:默认配置会产生哪些额外费用(如跨 AZ 流量费)?
三个不要
- 不要相信"开箱即用"——云厂商的默认配置是"最低可行配置",不是"最佳配置"
- 不要只看控制台——很多关键参数藏在配置文件或 API 里,控制台不显示
- 不要复制粘贴——理解每个参数的含义再调
"能用"和"可靠"之间,差的是你对每一个配置参数的理解和对生产环境的敬畏。