Prometheus高可用部署方案
基本HA模式
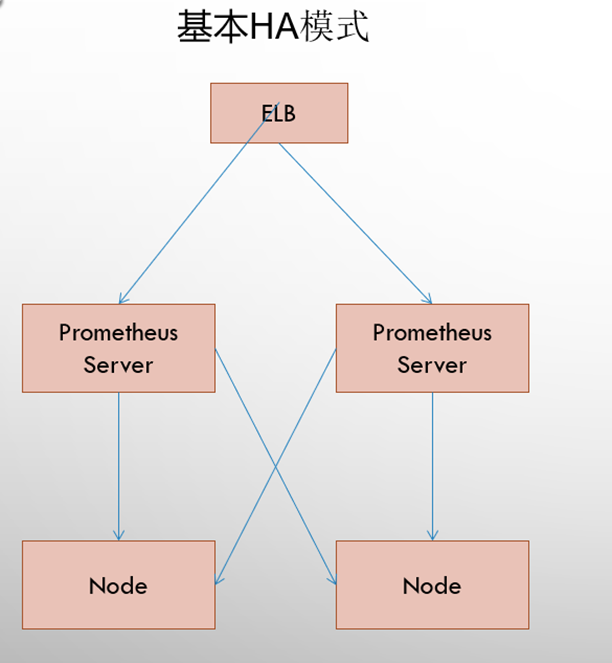
- 只能确保prometheus服务的高可用,但是不解决Prometheus Server之间的数据一致性问题以及持久化问题(数据丢失后无法恢复),也无法进行动态的扩展。因此这种部署方式适合监控规模不大,Promthues Server也不会频繁发生迁移的情况,并且只需要保存短周期监控数据的场景。
基本HA+远程存储
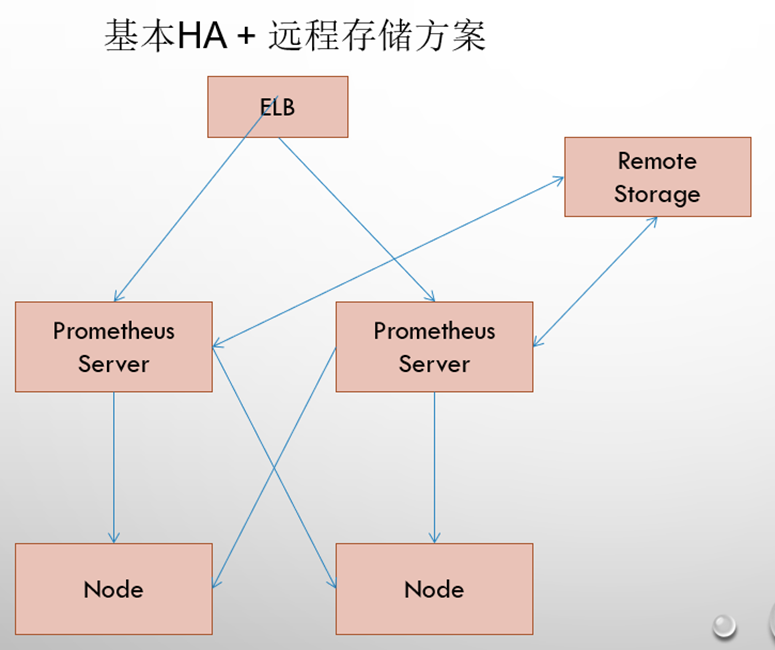
- 在解决了Promthues服务可用性的基础上,同时确保了数据的持久化,当Promthues Server发生宕机或者数据丢失的情况下,可以快速的恢复。 同时Promthues Server可能很好的进行迁移。因此,该方案适用于用户监控规模不大(几百台服务器的规模),但是希望能够将监控数据持久化,同时能够确保Promthues Server的可迁移性的场景。
基本HA+远程存储+联邦集群
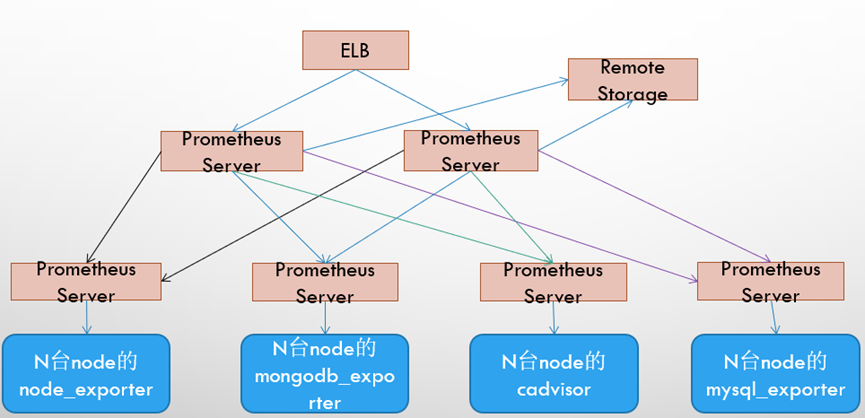
- Promthues的性能瓶颈主要在于大量的采集任务,因此用户需要利用Prometheus联邦集群的特性,将不同类型的采集任务划分到不同的Promthues子服务中,从而实现功能分区。
- 例如一个Promthues Server负责采集基础设施相关的监控指标,另外一个Prometheus Server负责采集应用监控指标。再有上层Prometheus Server实现对数据的汇聚。
- 这种方案比较耗费资源,规模较小的环境(几百台服务器)就没必要部署这种方案了。
prometheus监控k8s集群
-
对于Kubernetes而言,我们可以把当中所有的资源分为几类:
-
基础设施层(Node):集群节点,为整个集群和应用提供运行时资源
- 容器基础设施(Container):为应用提供运行时环境
- 用户应用(Pod):Pod中会包含一组容器,它们一起工作,并且对外提供一个(或者一组)功能
- 内部服务负载均衡(Service):在集群内,通过Service在集群暴露应用功能,集群内应用和应用之间访问时提供内部的负载均衡
-
外部访问入口(Ingress):通过Ingress提供集群外的访问入口,从而可以使外部客户端能够访问到部署在Kubernetes集群内的服务
-
因此,如果要构建一个完整的监控体系,我们应该考虑,以下5个方面:
-
集群节点状态监控:从集群中各节点的kubelet服务获取节点的基本运行状态;
-
集群节点资源用量监控:通过Daemonset的形式在集群中各个节点部署Node Exporter采集节点的资源使用情况;
-
节点中运行的容器监控:通过各个节点中kubelet内置的cAdvisor中获取个节点中所有容器的运行状态和资源使用情况;
-
如果在集群中部署的应用程序本身内置了对Prometheus的监控支持,那么我们还应该找到相应的Pod实例,并从该Pod实例中获取其内部运行状态的监控指标。
-
对k8s本身的组件做监控:apiserver、scheduler、controller-manager、kubelet、kube-proxy
部署node-exporter
- node-exporter可以采集机器(物理机、虚拟机、云主机等)的监控指标数据,能够采集到的指标包括CPU, 内存,磁盘,网络,文件数等信息。
安装node-exporter
kubectl create ns monitor-sa
apiVersion: apps/v1
kind: DaemonSet  #可以保证k8s集群的每个节点都运行完全一样的pod
metadata:
  name: node-exporter
  namespace: monitor-sa
  labels:
    name: node-exporter
spec:
  selector:
    matchLabels:
     name: node-exporter
  template:
    metadata:
      labels:
        name: node-exporter
    spec:
      hostPID: true
      hostIPC: true
      hostNetwork: true #表示这个pod不用网络插件划分Ip,共享宿主机IP,调度到哪个node上,就用哪个node的IP。
      # hostNetwork、hostIPC、hostPID都为True时,表示这个Pod里的所有容器,会直接使用宿主机的网络,直接与宿主机进行IPC(进程间通信)通信,可以看到宿主机里正在运行的所有进程。加入了hostNetwork:true会直接将我们的宿主机的9100端口映射出来,从而不需要创建service在宿主机上就会有一个9100的端口
      containers:
      - name: node-exporter
        image: prom/node-exporter:v0.16.0
        imagePullPolicy: IfNotPresent
        ports:
        - containerPort: 9100
        resources:
          requests:
            cpu: 0.15  #这个容器运行至少需要0.15核cpu
        securityContext:
          privileged: true  #开启特权模式,任何在容器内运行的进程都将拥有几乎与主机上运行的进程相同的权限。这意味着这些进程可以访问主机的所有资源,包括操作系统和硬件设备。
        args:
        - --path.procfs  #配置挂载宿主机(node节点)的路径
        - /host/proc
        - --path.sysfs  #配置挂载宿主机(node节点)的路径
        - /host/sys
        - --collector.filesystem.ignored-mount-points
        - '"^/(sys|proc|dev|host|etc)($|/)"' #node-exporter在收集文件系统指标时,将忽略挂载点路径以/sys、/proc、/dev、/host或/etc开头的文件系统。这些路径通常包含的是操作系统和运行环境的数据,而不是用户数据,因此通常不需要监控它们的文件系统使用情况。忽略这些路径可以减少node-exporter的输出,使得输出的指标更加关注于对用户更有价值的数据。
        volumeMounts:
        #将主机/dev、/proc、/sys这些目录挂到容器中,这是因为我们采集的很多节点数据都是通过这些文件来获取系统信息的。
        - name: dev
          mountPath: /host/dev
        - name: proc
          mountPath: /host/proc
        - name: sys
          mountPath: /host/sys
        - name: rootfs
          mountPath: /rootfs
      tolerations:
      - key: "node-role.kubernetes.io/master"
        operator: "Exists"
        effect: "NoSchedule"
      volumes:
        - name: proc
          hostPath:
            path: /proc
        - name: dev
          hostPath:
            path: /dev
        - name: sys
          hostPath:
            path: /sys
        - name: rootfs
          hostPath:
            path: /
验证exporter数据采集
#查看宿主机的9100端口占用
ss -antulp | grep :9100
#查看exporter采集到的数据
curl http://192.168.40.180:9100/metrics
部署prometheus
创建sa并授权
kubectl create serviceaccount monitor -n monitor-sa
#给sa和sa用户都授权,防止prometheus报错--user=system:serviceaccount:monitor:monitor-sa没有权限。
kubectl create clusterrolebinding monitor-clusterrolebinding -n monitor-sa --clusterrole=cluster-admin  --serviceaccount=monitor-sa:monitor

kubectl create clusterrolebinding monitor-clusterrolebinding-1 -n monitor-sa --clusterrole=cluster-admin --user=system:serviceaccount:monitor:monitor-sa
#将cluster-admin这个ClusterRole绑定到了一个特定的用户,这个用户是monitor命名空间下的monitor-sa这个ServiceAccount。这里的--user参数的值system:serviceaccount:monitor:monitor-sa是Kubernetes内部用来表示ServiceAccount的一种格式。
这两条命令的主要区别在于它们绑定的对象不同,第一条命令是直接绑定到一个
ServiceAccount,而第二条命令是绑定到一个表示ServiceAccount的用户。在实际使用中,这两种方式的效果是相同的,都是将cluster-admin这个ClusterRole的权限赋予了monitor命名空间下的monitor-sa这个ServiceAccount。
创建数据存储目录
#在node-1上创建数据目录并给满权限(否则prometheus写不进去数据)
mkdir /data
chmod 777 /data/
安装prometheus server服务
创建configmap存储配置
kind: ConfigMap
apiVersion: v1
metadata:
  labels:
    app: prometheus
  name: prometheus-config
  namespace: monitor-sa
data:
  prometheus.yml: |
    global:
      scrape_interval: 20s #采集目标主机监控据的时间间隔
      scrape_timeout: 10s #数据采集超时时间,默认10s
      evaluation_interval: 1m #触发告警检测的时间,默认是1m。这个时间间隔要大于采集数据的间隔,否则会产生多次重复告警。假如我们的指标是5m被拉取一次。检测根据evaluation_interval 1m一次,所以在值被更新前,我们一直用的旧值来进行多次判断,造成了1m一次,同一个指标被告警了4次。
    scrape_configs: #定义了Prometheus从哪些源收集指标数据。每个scrape_config块指定一组目标和参数,描述了如何从这些目标收集指标。
    - job_name: 'kubernetes-node'
      kubernetes_sd_configs: #使用的是k8s的服务发现
      - role: node #使用node模式,意味着Prometheus将从Kubernetes的节点收集指标。可能包括CPU使用率、内存使用量、磁盘空间等。
      relabel_configs: #定义标签重写规则
      - source_labels: [__address__] #更改__address__标签
        regex: '(.*):10250' #10250是kubelet的监听端口,为的是找到每个node,默认走kubelet10250来服务发现
        replacement: '${1}:9100' #把匹配到的ip:10250的ip保留,端口替换成exporter的9100端口
        target_label: __address__ #表示找这个node上面的exporter拿数据
        action: replace
      - action: labelmap
        regex: __meta_kubernetes_node_label_(.+) #匹配所有以__meta_kubernetes_node_label_开头的标签。这些标签是由Prometheus的Kubernetes服务发现生成的,包含了k8s节点的元数据。所以,这个labelmap动作将所有K8s节点的标签复制到Prometheus指标的标签中。这样,你就可以在Prometheus查询中使用这些标签
    - job_name: 'kubernetes-node-cadvisor' #抓取cAdvisor数据,是获取kubelet上/metrics/cadvisor接口数据来获取容器的资源使用情况
      kubernetes_sd_configs:
      - role:  node
      scheme: https
      tls_config:
        ca_file: /var/run/secrets/kubernetes.io/serviceaccount/ca.crt
      bearer_token_file: /var/run/secrets/kubernetes.io/serviceaccount/token
      relabel_configs:
      - action: labelmap
        regex: __meta_kubernetes_node_label_(.+)
      - target_label: __address__ ##获取到的地址:__address__="192.168.40.180:10250"
        replacement: kubernetes.default.svc:443 ##把获取到的地址替换成新的地址kubernetes.default.svc:443,这个svc后端关联到的pod是apiserver
      - source_labels: [__meta_kubernetes_node_name]
        regex: (.+)
        target_label: __metrics_path__
        replacement: /api/v1/nodes/${1}/proxy/metrics/cadvisor #将指标路径设置为每个节点的cAdvisor指标路径。cAdvisor是一个开源的容器监控工具,它内置在Kubernetes的节点中,提供了关于容器的详细指标。
    - job_name: 'kubernetes-apiserver'
      kubernetes_sd_configs:
      - role: endpoints #基于k8s的服务发现,走的是endpoint模式,采集apiserver 6443端口获取到的监控数据
      scheme: https
      tls_config:
        ca_file: /var/run/secrets/kubernetes.io/serviceaccount/ca.crt
      bearer_token_file: /var/run/secrets/kubernetes.io/serviceaccount/token
      relabel_configs:
      - source_labels: [__meta_kubernetes_namespace, __meta_kubernetes_service_name, __meta_kubernetes_endpoint_port_name]
        action: keep
        regex: default;kubernetes;https
    - job_name: 'kubernetes-service-endpoints' #创建svc的时候加一个annotation,svc就能被这个job监控到
      kubernetes_sd_configs:
      - role: endpoints
      relabel_configs:
      - source_labels: [__meta_kubernetes_service_annotation_prometheus_io_scrape]
        action: keep
        regex: true
      - source_labels: [__meta_kubernetes_service_annotation_prometheus_io_scheme]
        action: replace
        target_label: __scheme__
        regex: (https?)
      - source_labels: [__meta_kubernetes_service_annotation_prometheus_io_path]
        action: replace
        target_label: __metrics_path__
        regex: (.+)
      - source_labels: [__address__, __meta_kubernetes_service_annotation_prometheus_io_port]
        action: replace
        target_label: __address__
        regex: ([^:]+)(?::\d+)?;(\d+)
        replacement: $1:$2
      - action: labelmap
        regex: __meta_kubernetes_service_label_(.+)
      - source_labels: [__meta_kubernetes_namespace]
        action: replace
        target_label: kubernetes_namespace
      - source_labels: [__meta_kubernetes_service_name]
        action: replace
        target_label: kubernetes_name
summary:
job_name: 'kubernetes-node' :访问node exporter,获取物理机监控数据
job_name: 'kubernetes-node-cadvisor':可以请求到node上的kubelet的cAdvisior里面的监控数据
job_name: 'kubernetes-apiserver' :采集apiserver 6443端口获取到的监控数据
job_name: 'kubernetes-service-endpoints' :创建svc的时候加一个annotation,svc就能被这个job监控到
创建prometheus pod
- 通过deployment把prometheus server调度到有数据目录的node-1上面
---
apiVersion: apps/v1
kind: Deployment
metadata:
  name: prometheus-server
  namespace: monitor-sa
  labels:
    app: prometheus
spec:
  replicas: 1
  selector:
    matchLabels:
      app: prometheus
      component: server
    #matchExpressions:
    #- {key: app, operator: In, values: [prometheus]}
    #- {key: component, operator: In, values: [server]}
  template:
    metadata:
      labels:
        app: prometheus
        component: server
      annotations:
        prometheus.io/scrape: 'false'
    spec:
      nodeName: node-1 #直接指定要调度到的node
      serviceAccountName: monitor
      containers:
      - name: prometheus
        image: prom/prometheus:v2.2.1
        imagePullPolicy: IfNotPresent
        command:
          - prometheus
          - --config.file=/etc/prometheus/prometheus.yml
          - --storage.tsdb.path=/prometheus
          - --storage.tsdb.retention=240h
          - --web.enable-lifecycle
          #web.enable-lifecycle:修改配置之后不需要重新创建pod,会热加载
        ports:
        - containerPort: 9090
          protocol: TCP
        volumeMounts:
        - mountPath: /etc/prometheus
          name: prometheus-config
        - mountPath: /prometheus/
          name: prometheus-storage-volume
      volumes:
        - name: prometheus-config
          configMap:
            name: prometheus-config
        - name: prometheus-storage-volume
          hostPath:
           path: /data
           type: Directory
创建svc代理prometheus server
apiVersion: v1
kind: Service
metadata:
  name: prometheus
  namespace: monitor-sa
  labels:
    app: prometheus
spec:
  type: NodePort
  selector:
    app: prometheus
    component: server
  ports:
    - port: 9090
      targetPort: 9090
     protocol: TCP
查看prometheus UI
-
直接访问node IP:31408
-
在Status - Targets - kubernetes-service-endpoints里面能看到两个svc后端pod。这两个pod是coredns,svc是kube-dns。

- 为啥这个svc会被监控到?因为这个svc自带了annotation:
Name:              kube-dns
Namespace:         kube-system
Labels:            k8s-app=kube-dns
                   kubernetes.io/cluster-service=true
                   kubernetes.io/name=CoreDNS
Annotations:       prometheus.io/port: 9153
                   prometheus.io/scrape: true
prometheus监控常见服务
tomcat
-
tomcat_exporter地址:tomcat_exporter (GitHub)
-
下载相关包
metrics.war
simpleclient-0.8.0.jar
simpleclient_common-0.8.0.jar
simpleclient_hotspot-0.8.0.jar
simpleclient_servlet-0.8.0.jar
tomcat_exporter_client-0.0.12.jar
- 打包镜像
cat Dockerfile
FROM tomcat:8.5-jdk8-corretto
ADD metrics.war /usr/local/tomcat/webapps/
ADD simpleclient-0.8.0.jar  /usr/local/tomcat/lib/
ADD simpleclient_common-0.8.0.jar /usr/local/tomcat/lib/
ADD simpleclient_hotspot-0.8.0.jar /usr/local/tomcat/lib/
ADD simpleclient_servlet-0.8.0.jar /usr/local/tomcat/lib/
ADD tomcat_exporter_client-0.0.12.jar /usr/local/tomcat/lib/
docker build -t='tomcat_prometheus:v1' .
docker save -o
- 创建tomcat实例
apiVersion: apps/v1
kind: Deployment
metadata:
  name: dep-tomcat
  namespace: default
spec:
  selector:
    matchLabels:
     app: tomcat
  replicas: 2 # tells deployment to run 2 pods matching the template
  template: # create pods using pod definition in this template
    metadata:
      labels:
        app: tomcat
      annotations:
        prometheus.io/scrape: 'true'
    spec:
      containers:
      - name: tomcat
        image: tomcat_prometheus:v1
        ports:
        - containerPort: 8080
        securityContext:
          privileged: true
---
kind: Service
apiVersion: v1
metadata:
  name: svc-tomcat
  annotations:
    prometheus.io/scrape: 'true'
spec:
  selector:
    app: tomcat
  ports:
  - nodePort: 31360
    port: 80
    protocol: TCP
    targetPort: 8080
  type: NodePort
- prometheus中通过kubernetes-pods的job查看监控到的pod情况
redis
-
笔记地址:有道云笔记 - Redis监控
-
部署redis pod
apiVersion: apps/v1
kind: Deployment
metadata:
  name: redis
  namespace: kube-system
spec:
  replicas: 1
  selector:
    matchLabels:
      app: redis
  template:
    metadata:
      labels:
        app: redis
    spec:
      containers:
      - name: redis
        image: redis:4
        resources:
          requests:
            cpu: 100m
            memory: 100Mi
        ports:
        - containerPort: 6379
      - name: redis-exporter #包含两个容器,1是redis,2是redis_exporter
        image: oliver006/redis_exporter:latest
        resources:
          requests:
            cpu: 100m
            memory: 100Mi
        ports:
        - containerPort: 9121
---
kind: Service
apiVersion: v1
metadata:
  name: redis
  namespace: kube-system
  annotations:
    prometheus.io/scrape: "true"
    prometheus.io/port: "9121" # 由于Redis服务的metrics接口在redis-exporter 9121上,所以添加prometheus.io/port=9121这样的annotation,prometheus就会自动发现redis了
spec:
  selector:
    app: redis
  ports:
  - name: redis
    port: 6379
    targetPort: 6379
  - name: prom
    port: 9121
    targetPort: 9121
- grafana导入"Redis Cluster-1571393212519.json",可以在grafana中监控。
mysql
安装mysql和exporter
yum install mysql -y
yum install mariadb -y
tar -xvf mysqld_exporter-0.10.0.linux-amd64.tar.gz
cd mysqld_exporter-0.10.0.linux-amd64
cp -ar mysqld_exporter /usr/local/bin/
chmod +x /usr/local/bin/mysqld_exporter
登陆mysql为mysql_exporter创建账号并授权
# 创建数据库用户
mysql
CREATE USER 'mysql_exporter'@'localhost' IDENTIFIED BY 'Abcdef123!.';
# 对mysql_exporter用户授权
GRANT PROCESS, REPLICATION CLIENT, SELECT ON *.* TO 'mysql_exporter'@'localhost';
exit #退出mysql
配置mysql免密连db
cd mysqld_exporter-0.10.0.linux-amd64
cat my.cnf
[client]
user=mysql_exporter
password=Abcdef123!.
启动mysql_exporter
nohup ./mysqld_exporter --config.my-cnf=./my.cnf &
mysqld_exporter的监听端口是9104
配置prometheus configmap
#添加下面的job
- job_name: 'mysql'
  static_configs:
  - targets: ['192.168.40.180:9104']
#暴力重启
kubectl apply -f prometheus-alertmanager-cfg.yaml
kubectl delete -f prometheus-alertmanager-deploy.yaml
kubectl apply -f prometheus-alertmanager-deploy.yaml
#我测试可以手动删deploy的pod,新建出来的pod会用
grafana导入mysql监控
- mysql-overview_rev5.json
nginx
- 下载nginx-module-vts模块(这个模块可以采集nginx数据)
unzip nginx-module-vts-master.zip
mv nginx-module-vts-master /usr/local/
- 源码编译安装nginx
#下载nginx-1.15.7.tar.gz
tar zxvf nginx-1.15.7.tar.gz
cd nginx-1.15.7
./configure  --prefix=/usr/local/nginx --with-http_gzip_static_module --with-http_stub_status_module --with-http_ssl_module --with-pcre --with-file-aio --with-http_realip_module --add-module=/usr/local/nginx-module-vts-master
make && make install
- 修改nginx配置文件
vim /usr/local/nginx/conf/nginx.conf
//server下添加如下:
location /status {
        vhost_traffic_status_display;
        vhost_traffic_status_display_format html;
        }
//http中添加如下:
vhost_traffic_status_zone;
- 测试nginx配置文件是否合法
/usr/local/nginx/sbin/nginx -t
- 如果正确没问题,启动nginx
/usr/local/nginx/sbin/nginx
访问192.168.40.180/status可以看到nginx监控数据
- 安装nginx-vts-exporter
#下载nginx-vts-exporter-0.5.zip,nginx-vts-exporter的监听端口是9913
mv nginx-vts-exporter-0.5  /usr/local/
chmod +x /usr/local/nginx-vts-exporter-0.5/bin/nginx-vts-exporter
cd /usr/local/nginx-vts-exporter-0.5/bin
nohup ./nginx-vts-exporter  -nginx.scrape_uri http://192.168.40.180/status/format/json &
- 修改prometheus configmap,添加新的job
- job_name: 'nginx'
    scrape_interval: 5s
    static_configs:
    - targets: ['192.168.40.180:9913']
- grafana导入模板:nginx-vts-stats_rev2.json
mongodb
- 下载MongoDB和MongoDB exporter镜像
docker pull mongo
docker pull eses/mongodb_exporter
- 启动MongoDB
mkdir -p /data/db
docker run -d --name mongodb -p 27017:27017 -v /data/db:/data/db mongo
#创建mongo账号密码,给mongodb_exporter连接mongo用
#登录到容器
docker exec -it 24f910190790ade396844cef61cc66412b7af2108494742922c6157c5b236aac mongo admin
#设置密码
use admin
db.createUser({ user: 'admin', pwd: 'admin111111', roles: [ { role: "userAdminAnyDatabase", db: "admin" } ] })

exit
- 启动MongoDB exporter
docker run -d --name mongodb_exporter -p 30056:9104  percona/mongodb_exporter:0.34.0 --mongodb.uri mongodb://admin:admin111111@192.168.40.180:27017
#注:admin:admin111111这个就是上面启动mongodb后设置的密码,@后面接mongodb的ip和端口
- 更新prometheus configmap
#添加一个job_name
- job_name: 'mongodb'
  scrape_interval: 5s
  static_configs:
  - targets: ['192.168.40.180:30056']
pushgateway
介绍
-
Pushgateway是prometheus的一个组件,prometheus server默认是通过exporter主动获取数据(默认采取pull拉取数据),pushgateway则是通过被动方式推送数据到prometheus server,用户可以写一些自定义的监控脚本把需要监控的数据发送给pushgateway, 然后pushgateway再把数据发送给Prometheus server
-
Pushgateway优点:
-
Prometheus 默认采用定时pull 模式拉取targets数据,但是如果不在一个子网或者防火墙,prometheus就拉取不到targets数据,所以可以采用各个target往pushgateway上push数据,然后prometheus去pushgateway上定时pull数据
-
在监控业务数据的时候,需要将不同数据汇总, 汇总之后的数据可以由pushgateway统一收集,然后由 Prometheus 统一拉取。
-
pushgateway缺点:
-
Prometheus拉取状态只针对 pushgateway, 不能对每个节点都有效;
-
Pushgateway出现问题,整个采集到的数据都会出现问题
-
监控下线,prometheus还会拉取到旧的监控数据,需要手动清理 pushgateway不要的数据。
部署pushgateway
#在工作节点上
docker pull prom/pushgateway
docker run -d --name pushgateway -p 9091:9091 prom/pushgateway
#在浏览器访问192.168.40.181:9091 ui界面
- 修改prometheus configmap,添加job
- job_name: 'pushgateway'
      scrape_interval: 5s
      static_configs:
      - targets: ['192.168.40.181:9091']
      honor_labels: true
honor_labels配置说明
在 Prometheus 的配置中,honor_labels: true 是一个特殊的选项,它影响 Prometheus 如何处理冲突的标签。
-
在默认情况下(即
honor_labels为false或未设置时),如果 Prometheus 从目标实例抓取的指标数据中的标签和 Prometheus 服务器中已经存在的标签冲突,Prometheus 会保留已经存在的标签,并且添加一个新的标签exported_来保存抓取的标签。 -
但是,如果设置了
honor_labels: true,Prometheus 在处理冲突的标签时,会保留从目标实例抓取的标签,而不是已经存在的标签。这在某些情况下是有用的,例如,当你使用 Prometheus 的 Pushgateway 或者 Federation 功能时。 -
所以,
honor_labels: true的作用是让 Prometheus 在处理标签冲突时,优先保留从目标实例抓取的标签。
比如:
- pushgateway中推送上去的数据,有job和instance的label
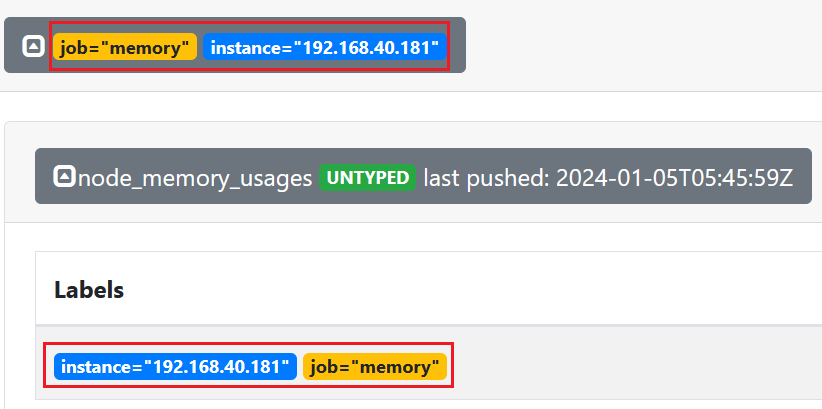
- prometheus中对于pushgateway也有job_name和instance,这个job和instance是指pushgateway实例本身

honor_labels: true定义好之后,prometheus和pushgateway的label各管各的,不冲突。
-
在prometheus的targets列表可以看到pushgateway
-
推送数据到pushgateway
#向 {job="test_job"} 添加单条数据:
echo "metric 3.6" | curl --data-binary @- http://192.168.40.181:9091/metrics/job/test_job
#注:--data-binary 表示发送二进制数据,注意:它是使用POST方式发送的!

#在 curl 命令中,@- 是一个特殊的符号,它表示从标准输入(stdin)读取数据。当你使用 --data-binary @- 选项时,curl 会等待从标准输入读取数据,直到遇到 EOF(End Of File)标记。在你的命令 echo "metric 3.6" | curl --data-binary @- http://192.168.40.181:9091/metrics/job/test_job 中,| 符号将 echo "metric 3.6" 的输出作为 curl --data-binary @- 的标准输入。所以,@- 在这里表示的就是 "metric 3.6" 这个字符串。

#prometheus中直接搜metrics指标,可以看到3.6
#推送复杂数据
cat <<EOF | curl --data-binary @- http://192.168.40.181:9091/metrics/job/test_job/instance/test_instance
node_memory_usage 37
node_memory_total 36000
EOF
- 删除数据
#删除某个实例下面的数据
curl -X DELETE http://192.168.40.181:9091/metrics/job/test_job/instance/test_instance
#删除某个组下的所有数据:
curl -X DELETE http://192.168.40.181:9091/metrics/job/test_job
## 脚本方式动态推送到pushgateway
#写个脚本
node_memory_usages=$(free -m | grep Mem | awk '{print $3/$2*100}')
#把free输出的第三列除以第二列,就是内存使用百分比
job_name="memory"
instance_name="192.168.40.181"

cat <<EOF | curl --data-binary @- http://192.168.40.181:9091/metrics/job/$job_name/instance/$instance_name
node_memory_usages $node_memory_usages
EOF
sh push.sh #测试一下推送结果
#写定时任务,定时上报数据
chmod +x push.sh
crontab -e
*/1 * * * * /usr/bin/bash  /k8s/push.sh
prometheus热加载
- 为了每次修改配置文件可以热加载prometheus,也就是不停止prometheus就可以使配置生效,想要使配置生效可用如下热加载命令:
#查看prometheus server的pod IP
kubectl get pods -n monitor-sa -o wide -l app=prometheus
#推送更新
curl -X POST http://<pod ip>:9090/-/reload
#前提是在prometheus server的deployment yaml中配置了参数:--web.enable-lifecycle
- 另一种方式是暴力重启prometheus:kubectl delete 删掉configmap和deploy,再重新apply。这样会造成监控数据中断甚至丢失。推荐热加载。
PromQL查询语言
- PromQL(Prometheus Query Language)是 Prometheus 自己开发的表达式语言,语言表现力很丰富,内置函数也很多。使用它可以对时序数据进行筛选和聚合。
数据类型
PromQL 表达式计算出来的值有以下几种类型:
-
瞬时向量 (Instant vector): 一组时序,每个时序只有一个采样值
-
区间向量 (Range vector): 一组时序,每个时序包含一段时间内的多个采样值
-
标量数据 (Scalar): 一个浮点数
-
字符串 (String): 一个字符串,暂时未用
瞬时向量选择器
- 瞬时向量选择器用来选择一组时序在某个采样点的采样值。最简单的情况就是指定一个度量指标,选择出所有属于该度量指标的时序的当前采样值。
-
比如下面的表达式:
apiserver_request_total,可以通过在后面添加用大括号包围起来的一组标签键值对来对时序进行过滤。比如下面的表达式筛选出了 job 为 kubernetes-apiservers,并且 resource为 pod的时序:apiserver_request_total{job="kubernetes-apiserver",resource="pods"} -
匹配标签值时可以是等于,也可以使用正则表达式。总共有下面几种匹配操作符:
-
=:完全相等
-
!=: 不相等
-
=~: 正则表达式匹配
-
!~: 正则表达式不匹配
-
下面的表达式筛选出了container是kube-scheduler或kube-proxy或kube-apiserver的时序数据:
container_processes{container=~"kube-scheduler|kube-proxy|kube-apiserver"}
区间向量选择器
- 区间向量选择器类似于瞬时向量选择器,不同的是它选择的是过去一段时间的采样值。可以通过在瞬时向量选择器后面添加包含在 [] 里的时长来得到区间向量选择器。
- 比如下面的表达式选出了所有度量指标为apiserver_request_total且resource是pod的时序在过去1分钟的采样值:
apiserver_request_total{job="kubernetes-apiserver",resource="pods"}[1m]
偏移向量选择器
- 偏移修饰器用来调整基准时间,使其往前偏移一段时间。偏移修饰器紧跟在选择器后面,使用 offset 来指定要偏移的量。
-
比如下面的表达式选择度量名称为apiserver_request_total的所有时序在 5 分钟前的采样值:
apiserver_request_total{job="kubernetes-apiserver",resource="pods"} offset 5m -
下面的表达式选择apiserver_request_total 度量指标在 1 周前的这个时间点过去 5 分钟的采样值:
apiserver_request_total{job="kubernetes-apiserver",resource="pods"} [5m] offset 1w
聚合操作符
-
PromQL 的聚合操作符用来将向量里的元素聚合得更少。总共有下面这些聚合操作符:
-
sum:求和
-
min:最小值
-
max:最大值
-
avg:平均值
-
stddev:标准差
-
stdvar:方差
-
count:元素个数
-
count_values:等于某值的元素个数
-
bottomk:最小的 k 个元素
-
topk:最大的 k 个元素
-
quantile:分位数
-
如:
-
计算xianchaomaster1节点所有容器总计内存
sum(container_memory_usage_bytes{instance=~"xianchaomaster1"})/1024/1024/1024 -
计算xianchaomaster1节点最近1m所有容器cpu使用率
sum (rate (container_cpu_usage_seconds_total{instance=~"xianchaomaster1"}[1m])) / sum (machine_cpu_cores{ instance =~"xianchaomaster1"}) * 100 -
计算最近1m所有容器cpu使用率的总和
sum (rate (container_cpu_usage_seconds_total{id!="/"}[1m])) by (id)#把id会打印出来
rate()函数用于计算时间序列数据的平均速率。这个函数通常用于处理计数器类型的指标
函数
-
Prometheus 内置了一些函数来辅助计算,下面介绍一些典型的。
-
abs():绝对值
-
sqrt():平方根
-
exp():指数计算
-
ln():自然对数
-
ceil():向上取整
-
floor():向下取整
-
round():四舍五入取整
-
delta():计算区间向量里每一个时序第一个和最后一个的差值
-
sort():排序