Grafana
Grafana简介
- Grafana是一个跨平台的开源的度量分析和可视化工具,可以将采集的数据可视化的展示,并及时通知给告警接收方。(自带alert功能,但是不常用,一般用专业alert服务比如alertmanager)
部署Grafana服务
#grafana用到的镜像为k8s.gcr.io/heapster-grafana-amd64:v5.0.4
#可以创建pod的时候拉取,也可以先上传到node上
docker load -i k8s.gcr.io/heapster-grafana-amd64:v5.0.4
#上传grafana的yaml文件
kubectl apply -f dep-grafana.yaml
apiVersion: apps/v1
kind: Deployment
metadata:
  name: monitoring-grafana
  namespace: kube-system
spec:
  replicas: 1
  selector:
    matchLabels:
      task: monitoring
      k8s-app: grafana
  template:
    metadata:
      labels:
        task: monitoring
        k8s-app: grafana
    spec:
      containers:
      - name: grafana
        image: k8s.gcr.io/heapster-grafana-amd64:v5.0.4
        imagePullPolicy: IfNotPresent
        ports:
        - containerPort: 3000
          protocol: TCP
        volumeMounts:
        - mountPath: /etc/ssl/certs
          name: ca-certificates
          readOnly: true
        - mountPath: /var
          name: grafana-storage
        env:
        - name: INFLUXDB_HOST
          value: monitoring-influxdb
        - name: GF_SERVER_HTTP_PORT
          value: "3000"
          # The following env variables are required to make Grafana accessible via
          # the kubernetes api-server proxy. On production clusters, we recommend
          # removing these env variables, setup auth for grafana, and expose the grafana
          # service using a LoadBalancer or a public IP.
        - name: GF_AUTH_BASIC_ENABLED
          value: "false"
        - name: GF_AUTH_ANONYMOUS_ENABLED
          value: "true"
        - name: GF_AUTH_ANONYMOUS_ORG_ROLE
          value: Admin
        - name: GF_SERVER_ROOT_URL
          # If you're only using the API Server proxy, set this value instead:
          # value: /api/v1/namespaces/kube-system/services/monitoring-grafana/proxy
          value: /
      volumes:
      - name: ca-certificates
        hostPath:
          path: /etc/ssl/certs
      - name: grafana-storage
        emptyDir: {}
---
apiVersion: v1
kind: Service
metadata:
  labels:
    # For use as a Cluster add-on (https://github.com/kubernetes/kubernetes/tree/master/cluster/addons)
    # If you are NOT using this as an addon, you should comment out this line.
    kubernetes.io/cluster-service: 'true'
    kubernetes.io/name: monitoring-grafana
  name: monitoring-grafana
  namespace: kube-system
spec:
  # In a production setup, we recommend accessing Grafana through an external Loadbalancer
  # or through a public IP.
  # type: LoadBalancer
  # You could also use NodePort to expose the service at a randomly-generated port
  # type: NodePort
  ports:
  - port: 80
    targetPort: 3000
  selector:
    k8s-app: grafana
  type: NodePort
接入prometheus服务
配置UI界面
-
通过nodeport的svc进入UI界面
-
选择Create your first data source
-
Name: Prometheus
-
Type: Prometheus
-
HTTP 处的URL:http://prometheus.monitor-sa.svc.cluster.local:9090
-
配置好的整体页面如下:
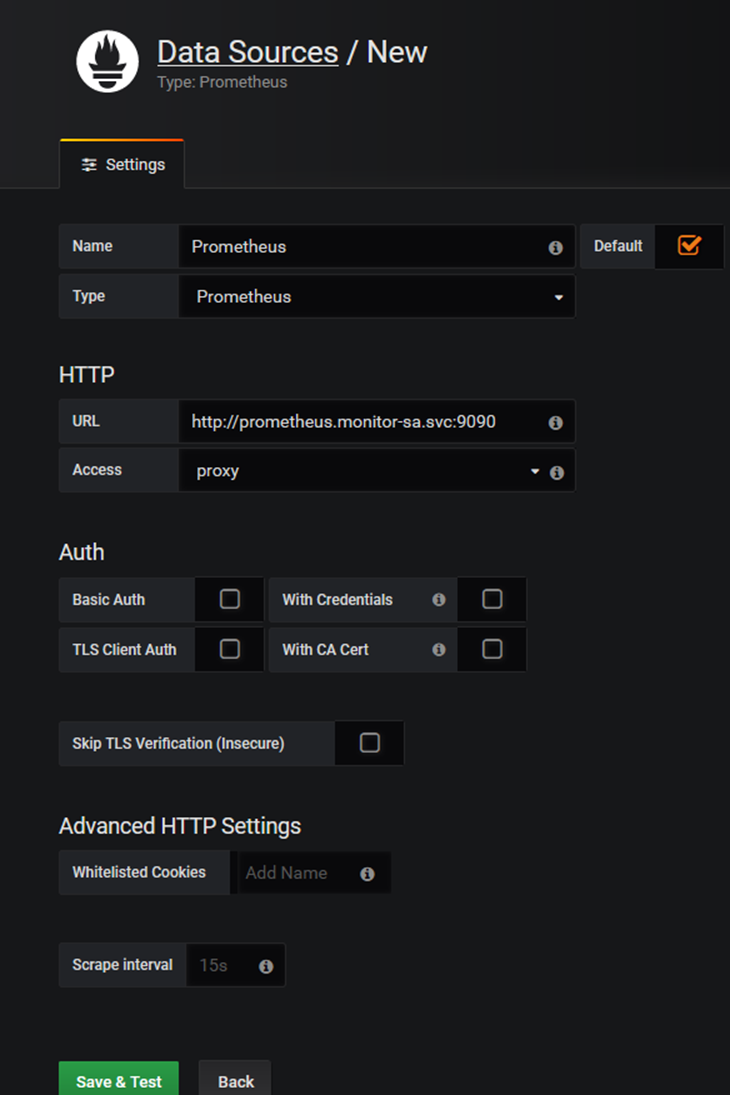
- 点击左下角Save & Test,出现如下Data source is working,说明prometheus数据源成功的被grafana接入了
部署模板
-
导入监控模板:
-
监控模板可以在官网下载:Grafana Dashboards
-
在左侧filter中筛选,一个个测试
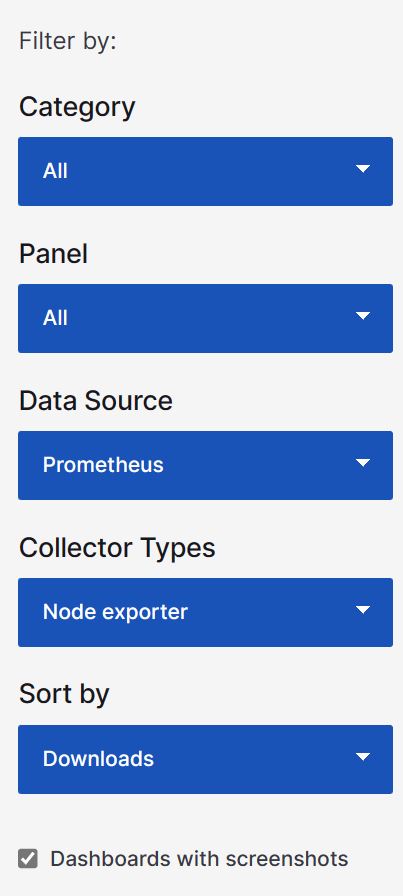
- 比如node-exporter:Node Exporter Full | Grafana Labs
-
在左侧Create-Import中导入json文件,这里导入了docker_rev1.json和node_exporter.json两个文件。
查看表的query
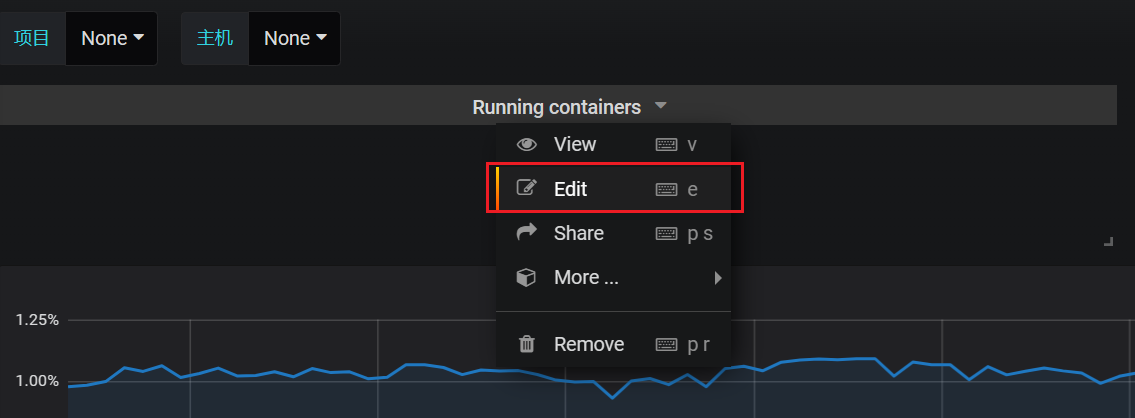
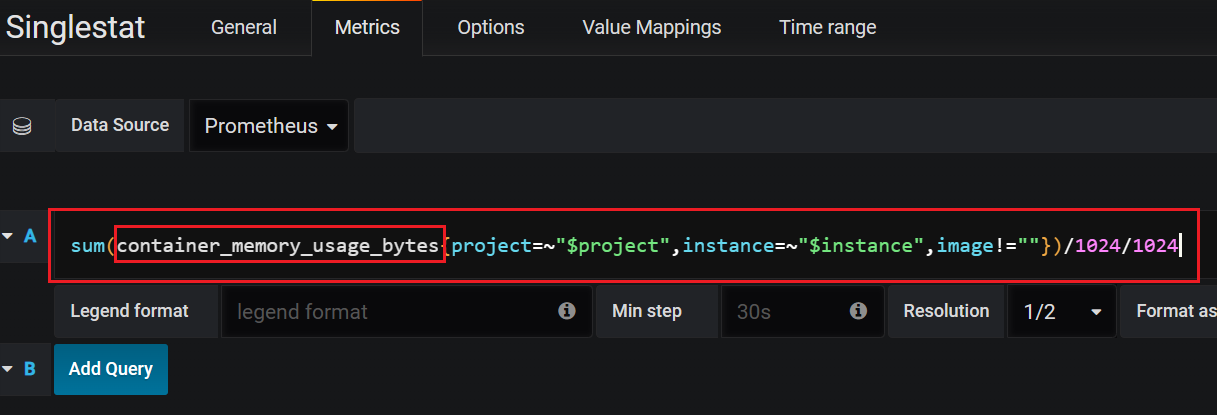
- 在表头上的edit里面可以看到图表使用的什么query
-
如果某个指标或者table没数:
-
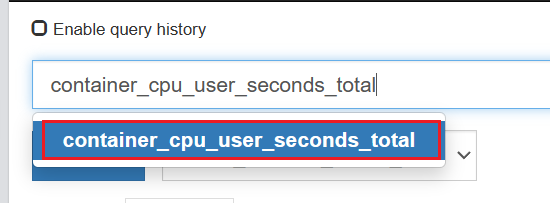
可以通过edit找到这个指标名称,放到prometheus中execute查一下,如果prometheus中都没数据,说明这个指标没被采集。可以从后往前删,看看是不是因为版本问题导致的拼写差异。找到prometheus中正确的写法之后,再修改grafana中的query。
监控pod:kube-state-metrics组件
ksm简介
- kube-state-metrics监听API Server生成有关资源对象的状态指标,比如Node、Pod。
- 需要注意的是kube-state-metrics只是简单的提供一个metrics数据,并不会存储这些指标数据,所以我们可以使用Prometheus来抓取这些数据然后存储。
- 主要关注的是业务相关的元数据,比如Pod副本状态;调度了多少个replicas;现在可用的有几个;多少个Pod是running/stopped/terminated状态;Pod重启了多少次;有多少job在运行中。
部署ksm
创建sa并授权
---
apiVersion: v1
kind: ServiceAccount
metadata:
  name: kube-state-metrics
  namespace: kube-system
---
apiVersion: rbac.authorization.k8s.io/v1
kind: ClusterRole
metadata:
  name: kube-state-metrics
rules:
- apiGroups: [""]
  resources: ["nodes", "pods", "services", "resourcequotas", "replicationcontrollers", "limitranges", "persistentvolumeclaims", "persistentvolumes", "namespaces", "endpoints"]
  verbs: ["list", "watch"]
- apiGroups: ["extensions"]
  resources: ["daemonsets", "deployments", "replicasets"]
  verbs: ["list", "watch"]
- apiGroups: ["apps"]
  resources: ["statefulsets"]
  verbs: ["list", "watch"]
- apiGroups: ["batch"]
  resources: ["cronjobs", "jobs"]
  verbs: ["list", "watch"]
- apiGroups: ["autoscaling"]
  resources: ["horizontalpodautoscalers"]
  verbs: ["list", "watch"]
---
apiVersion: rbac.authorization.k8s.io/v1
kind: ClusterRoleBinding
metadata:
  name: kube-state-metrics
roleRef:
  apiGroup: rbac.authorization.k8s.io
  kind: ClusterRole
  name: kube-state-metrics
subjects:
- kind: ServiceAccount
  name: kube-state-metrics
  namespace: kube-system
部署ksm pod
- 上传并解压quay.io/coreos/kube-state-metrics:v1.9.0镜像(不上传也能拉下来)
- 创建deployment
apiVersion: apps/v1
kind: Deployment
metadata:
  name: kube-state-metrics
  namespace: kube-system
spec:
  replicas: 1
  selector:
    matchLabels:
      app: kube-state-metrics
  template:
    metadata:
      labels:
        app: kube-state-metrics
    spec:
      serviceAccountName: kube-state-metrics
      containers:
      - name: kube-state-metrics
        image: quay.io/coreos/kube-state-metrics:v1.9.0
        imagePullPolicy: IfNotPresent
        ports:
        - containerPort: 8080
- 创建svc
apiVersion: v1
kind: Service
metadata:
  annotations:
    prometheus.io/scrape: 'true'
  name: kube-state-metrics
  namespace: kube-system
  labels:
    app: kube-state-metrics
spec:
  selector:
    app: kube-state-metrics
  ports:
  - name: kube-state-metrics
    port: 8080
    protocol: TCP
grafana基于ksm监控pod信息
- ksm部署好之后,可以在grafana中导入以下两个json:
- Kubernetes Cluster (Prometheus)-1577674936972.json
- Kubernetes cluster monitoring (via Prometheus) (k8s 1.16)-1577691996738.json